VISUALIZE WITH CONFIDENCE:
Build, share, and analyze visualizations without the risks — engineered with your data's safety
in mind, DVI makes analytics infrastructure accessible to everyone.
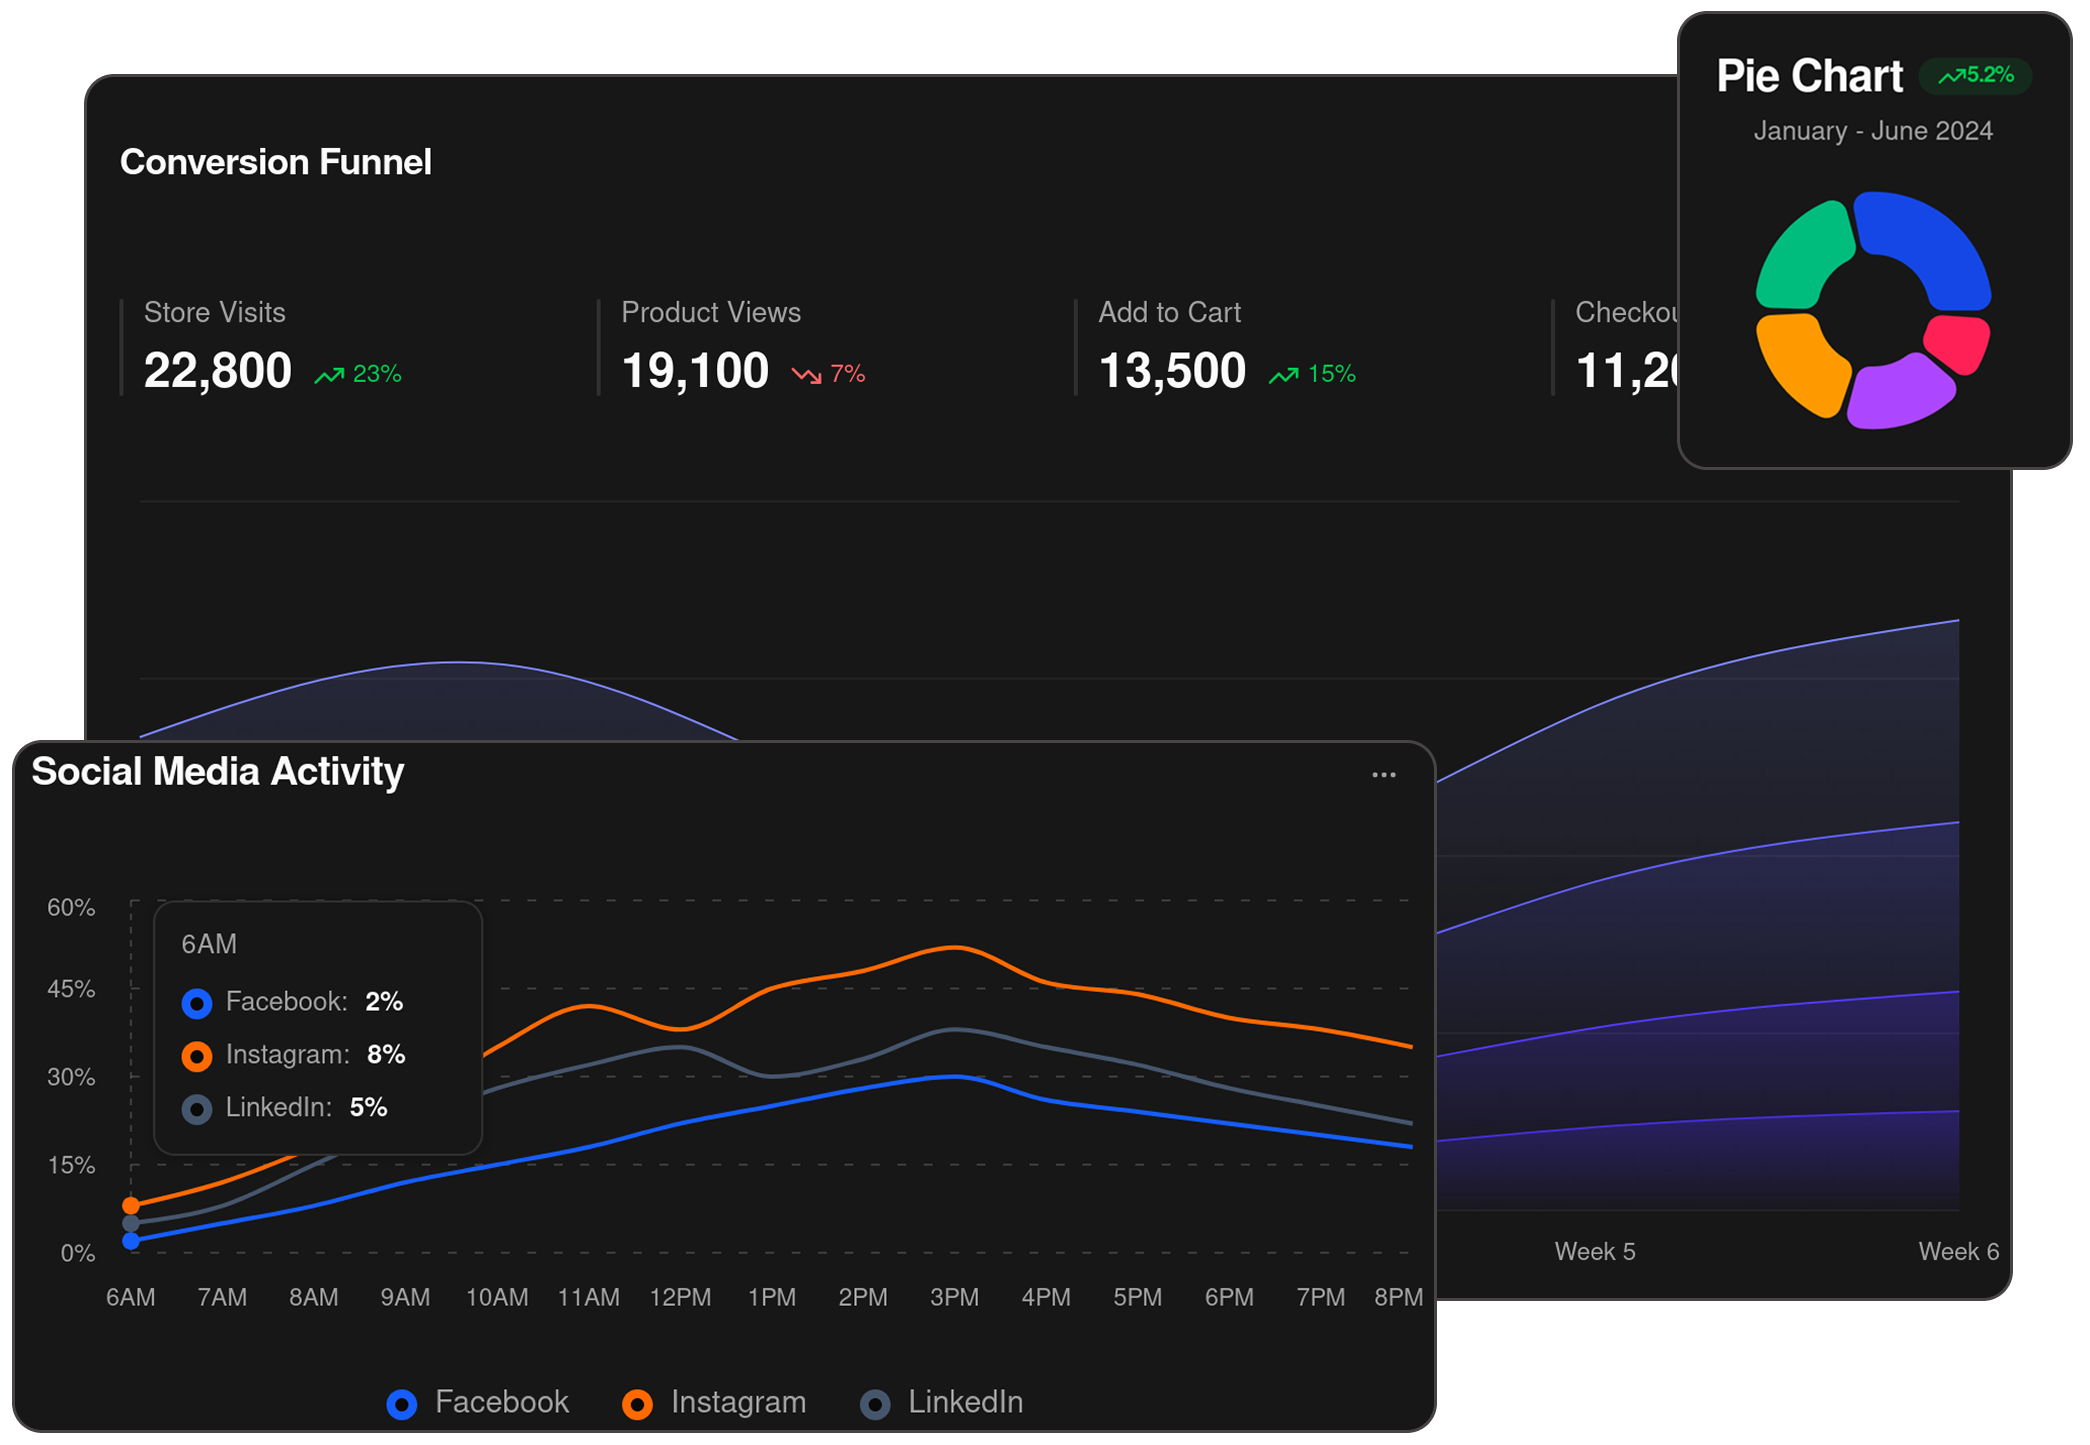
VARIOUS CHARTS SUPPORT
Unlock deeper understanding with a rich selection of chart types: funnel breakdowns, donut/pie distributions, layered area graphs, time-series comparisons, and more. Our flexible visualizations help you spot patterns, track progress, and communicate insights clearly.
HIGHLY CUSTOMIZABLE VISUALIZATIONS
Full control at your fingertips. Rearrange widgets, resize charts, customize colors, legends, labels, and summaries seamlessly. Create custom templates to easily apply the visualizations you need. Make your dashboard exactly how you want it.
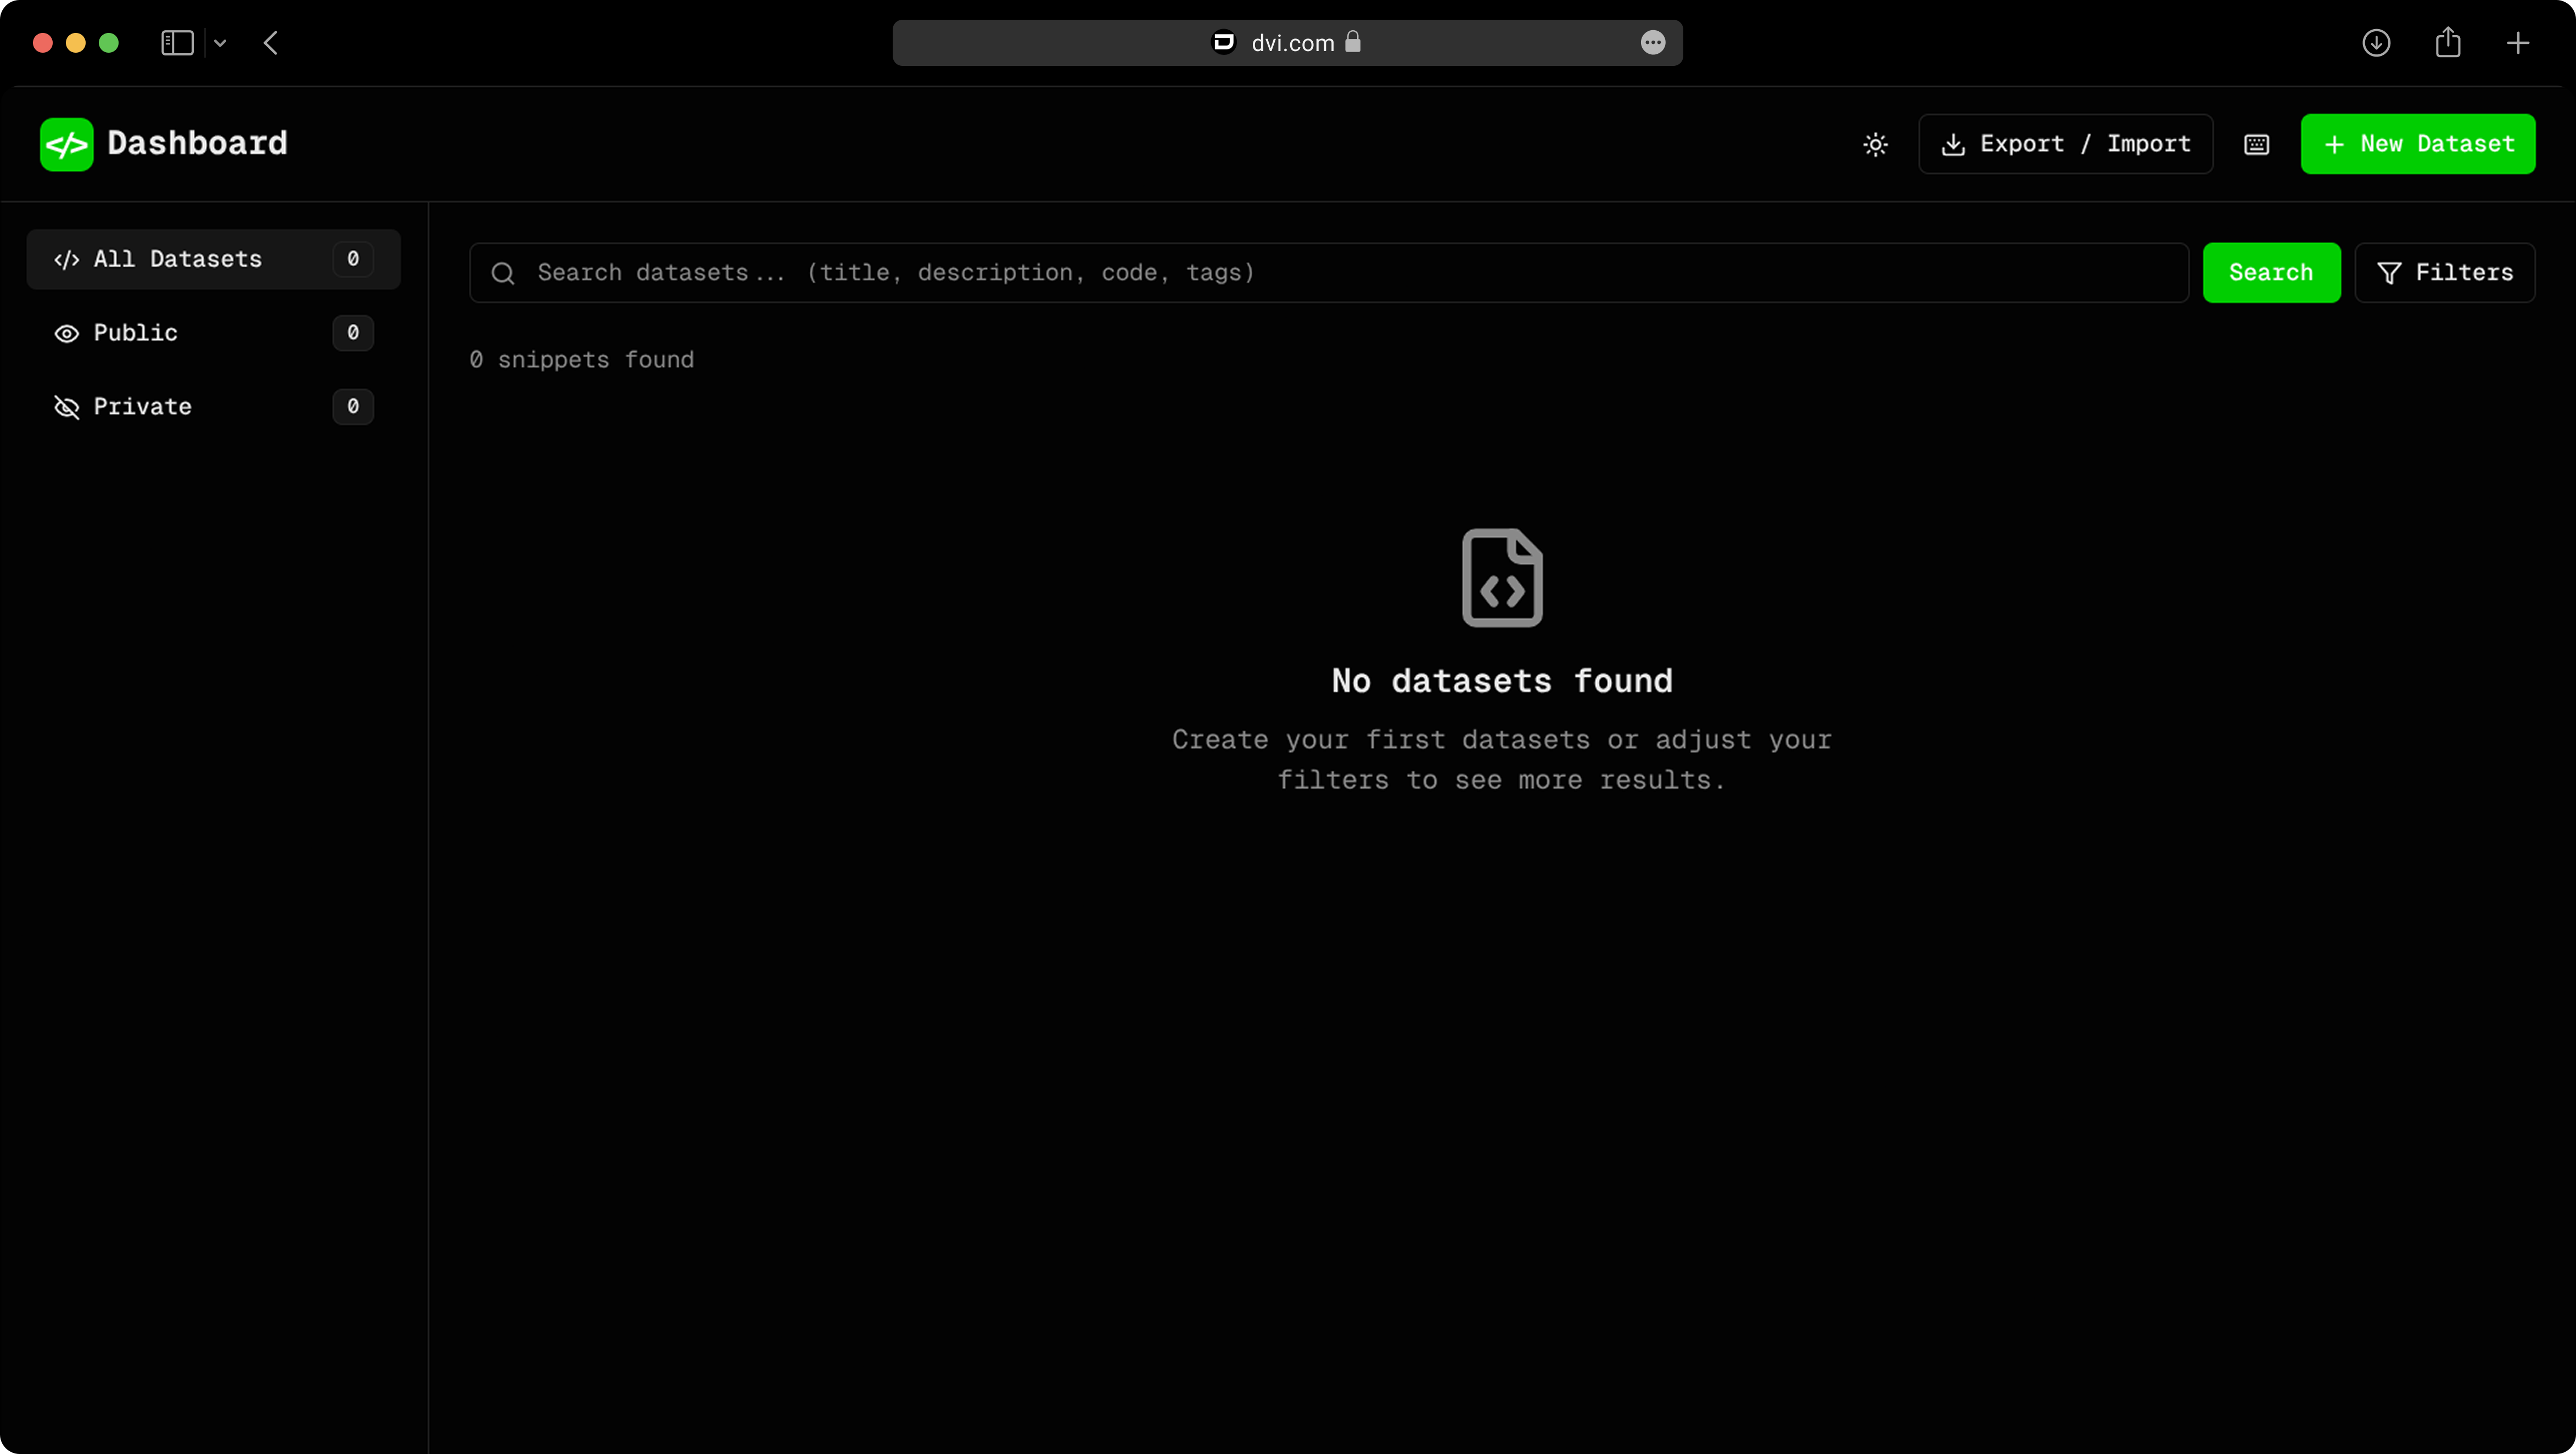
INTUITIVE INTERFACE
A thoughtfully designed file hub that feels instantly familiar. Fast uploads, instant search, one-click sorting, bulk selection, and per-file actions — all in a clean workspace. Forget about bloated dashboards.
STAY INFORMED ABOUT YOUR WORKSPACE
A dedicated monitoring hub delivers real-time updates for system resources, so you always know what's happening. Receive instant notifications to keep yourself aligned, spot issues, and control resources.
Choose your plan
Check out our Individual, Business, and Enterprise plans, available on a monthly and annual subscription basis. Choose the one that suits you best.
Basic
For most individuals
- No payment credentials required
- Limited AI analysis
- Up to 7 projects at once
- 10GB of processing per week
- 5GB storage
Pro
For advanced enthusiasts
- Advanced visualizations
- Extended AI analysis limits
- Unlimited projects
- 50GB of processing per week
- 40GB storage
Business
For small companies/startups
- Access to API
- 24/7 priority support
- Early access to new features
- Unlimited everything
Enterprise
For large organizations
Custom
- Custom quote
- Flexible terms
- Custom service configuration
- Support for compliance with privacy laws
- Invoicing and billing, volume discounts